![]()
Spending & Income Dashboards Analyze your spending and income over time by category and group. Filter data with slicers, drill down into specific transactions, and identify trends with moving average trendlines.
Comprehensive dashboards for spending, income, networth, and cashflow analysis with powerful visualizations.
Excel-based solution means your data stays on your computer. No subscriptions, no cloud lock-in, complete privacy.
Use as-is or customize to fit your needs. No macros or VBA required - built entirely with formulas and pivot tables.
![]()
Spending & Income Dashboards Analyze your spending and income over time by category and group. Filter data with slicers, drill down into specific transactions, and identify trends with moving average trendlines.
![]()
Networth Dashboard Track your assets, liabilities, and resulting networth over time. See your financial progress at a glance with clear visualizations of your wealth growth.
![]()
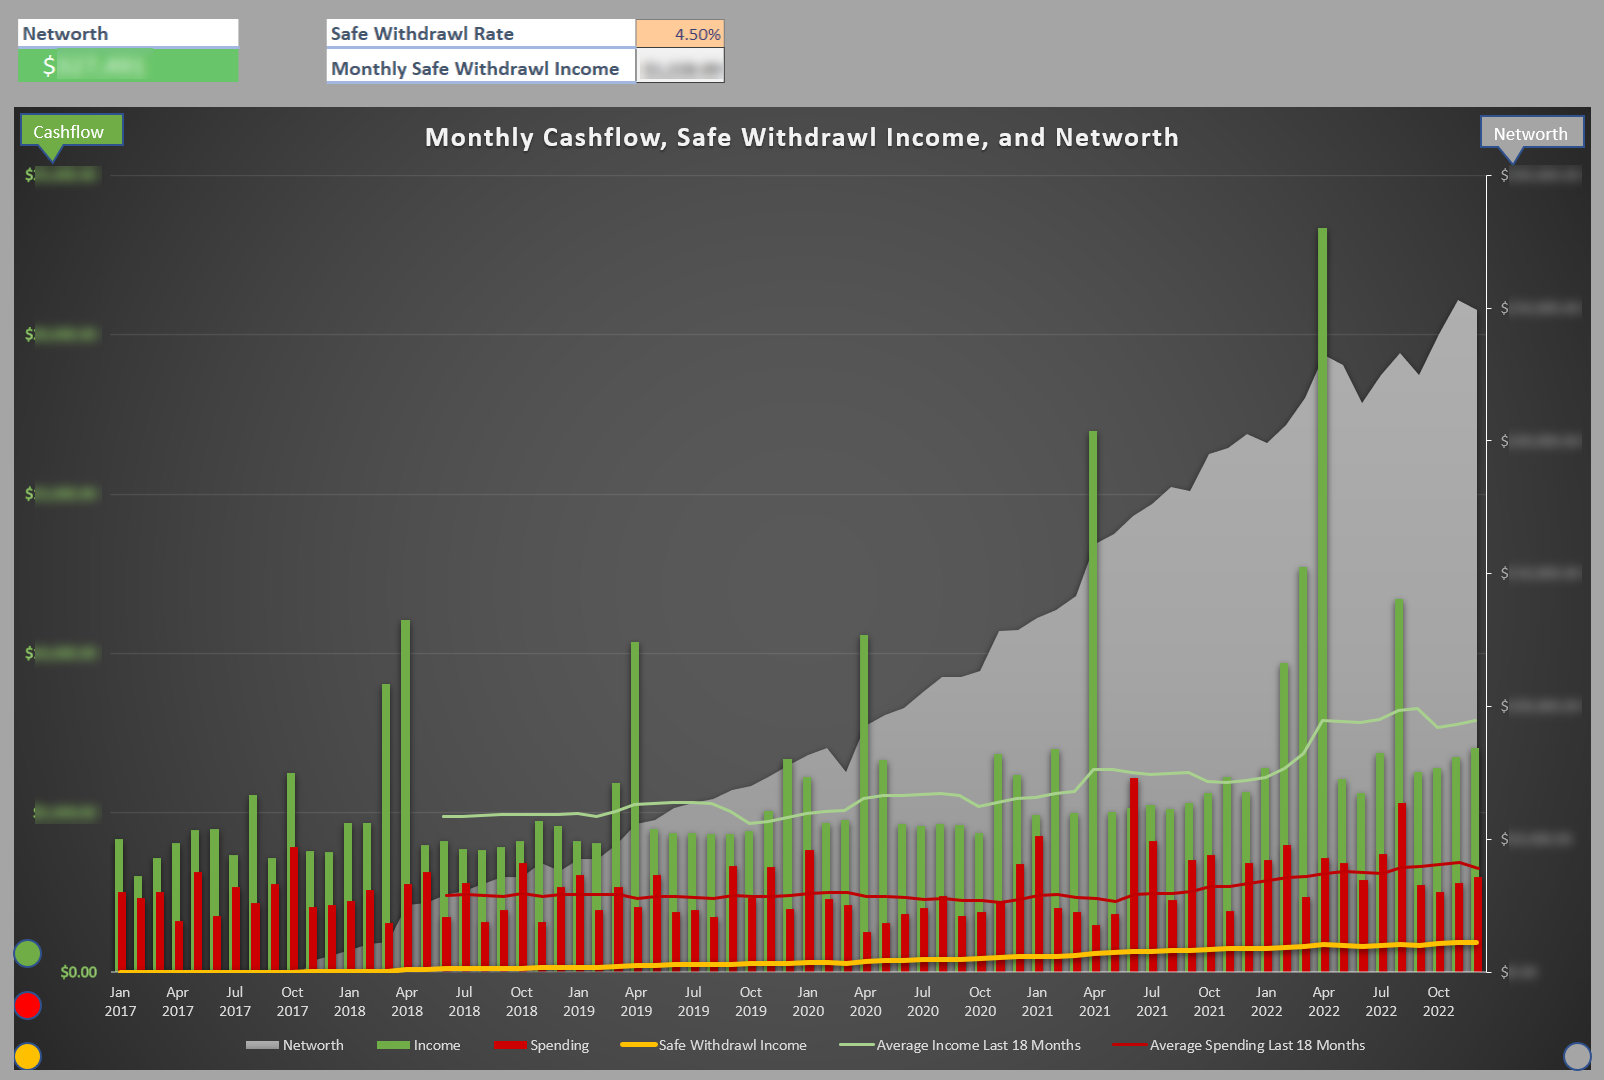
Cashflow Dashboard Visualize your total income and spending over time, calculate your savings rate, and see the distribution of your monthly spending via histogram.
![]()
Tiller Integration Designed to integrate seamlessly with Tiller for automatic transaction and balance imports. Also works as a standalone workbook for manual data entry.
![]()
Year-to-Date Summary Get a comprehensive summary of your year-to-date finances including monthly cashflow, spending and income by category, and current networth.
![]()
Financial Independence Tracking Track your progress toward financial independence with safe withdrawal rate calculations and visualizations showing when your investments can support your lifestyle.
We're collecting testimonials from users. Your feedback could be featured here! Contact us after using the workbook.

Have you found value in this workbook? We'd love to hear about your experience and how it's helped you understand your finances better.

Share your story! Tell us how the Cashflow & Networth Analysis Workbook has impacted your financial planning journey.

Send your questions or feedback to jackmansean64@gmail.com and we'll get back to you.
Email Us